Explainability — SHAP values
A four-year machine learning analysis of persistent absence in English state schools finds that Free School Meals eligibility outperforms area deprivation as a predictor by a factor of nineteen to one.
Persistent absence, missing at least 10% of possible school sessions, has long been treated as a proxy for disadvantage. The assumption is that it clusters in deprived areas, and that area-level interventions can reach the pupils most at risk. This analysis, covering roughly 79,000 school-year observations across four academic years, tests that assumption directly.
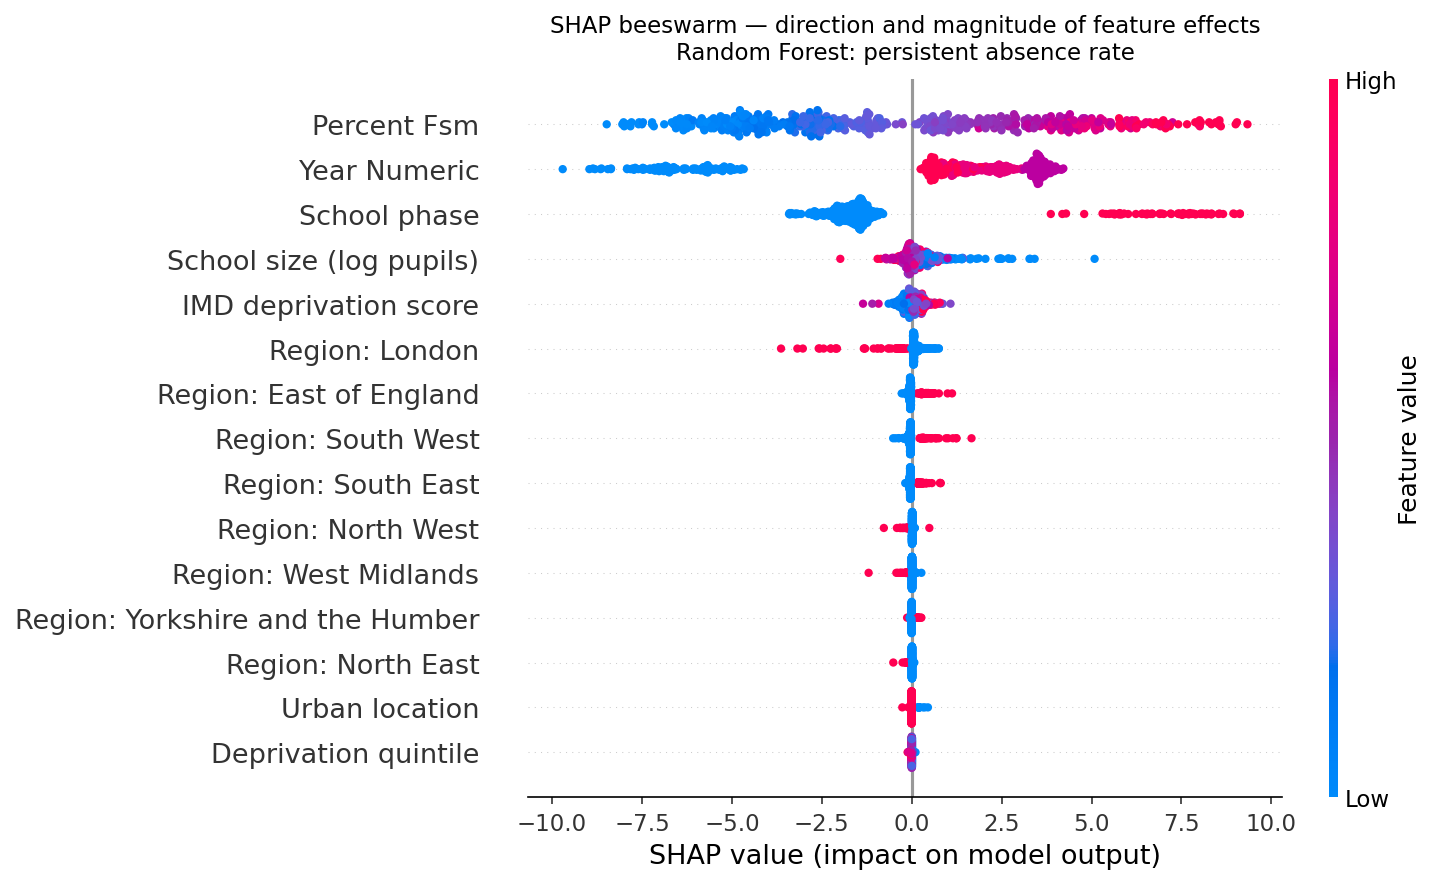
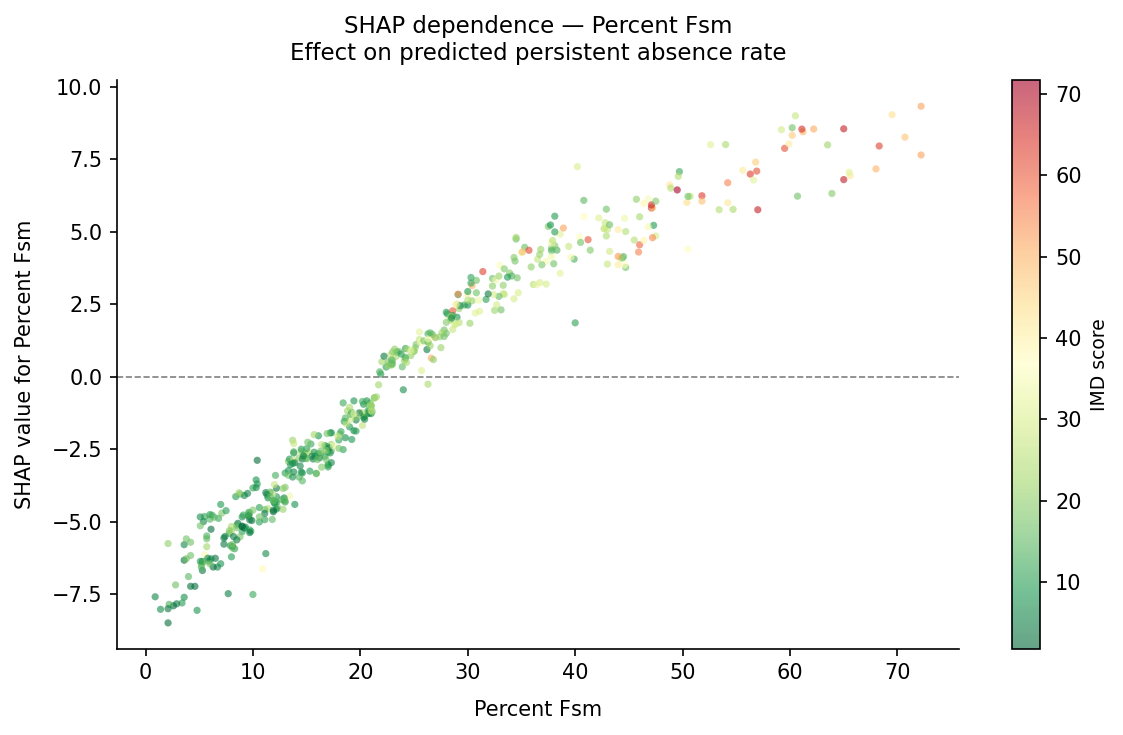
Free School Meals eligibility is nineteen times more predictive of absence rates than the Index of Multiple Deprivation score of the area a school sits in. Area deprivation is real but it is a blunt instrument, and the model makes that gap visible.
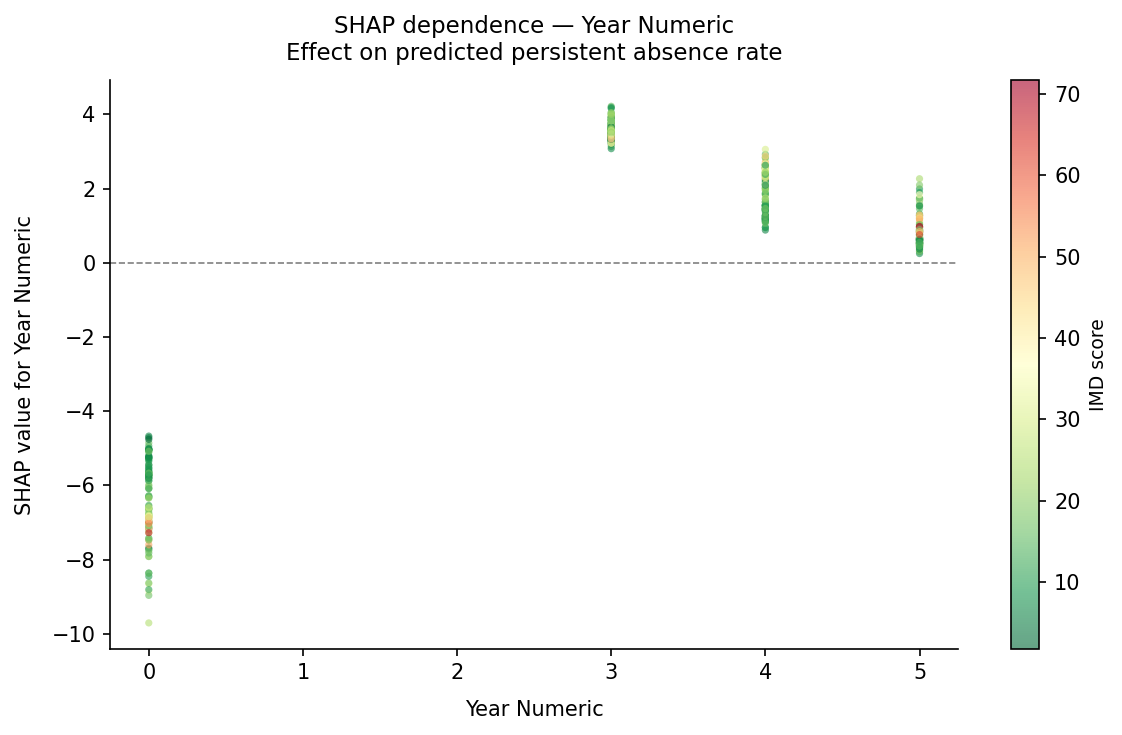
The year a school year falls in is the second strongest predictor in the model. Not because school years inherently differ, but because COVID-19 caused a structural break in attendance norms that is still visible in 2023-24 data. When the SHAP dependence plots are split by deprivation level, the shock is flat across that spectrum. The pandemic hit every school at roughly the same magnitude.
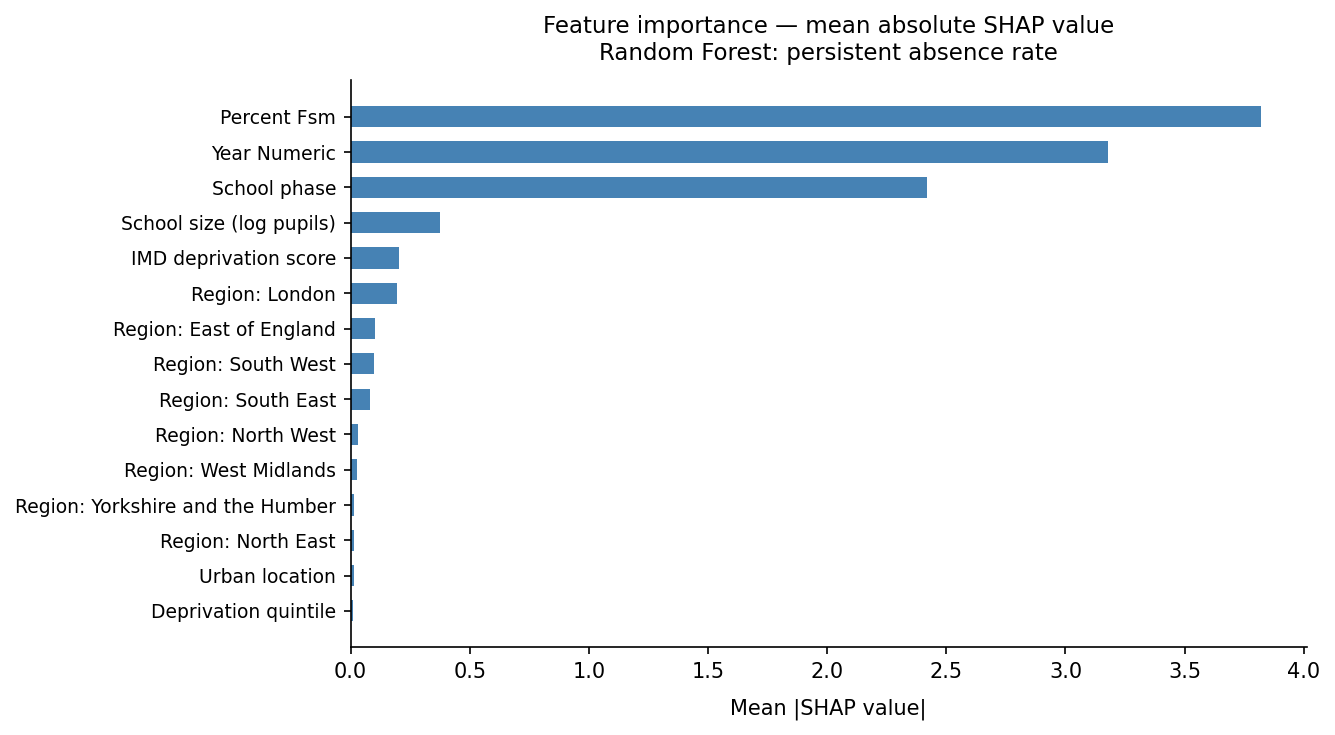
Random Forest feature importances, trained on roughly 79,000 school-year observations split by school URN to prevent leakage.
Test set performance. RF trained with GridSearchCV (n_estimators=300, max_depth=10). OLS baseline uses same feature set.
| Feature | Importance | Description |
|---|---|---|
| percent_fsm | 0.397 | % pupils eligible for Free School Meals |
| year_numeric | 0.298 | Academic year encoded 0–5 (captures COVID break) |
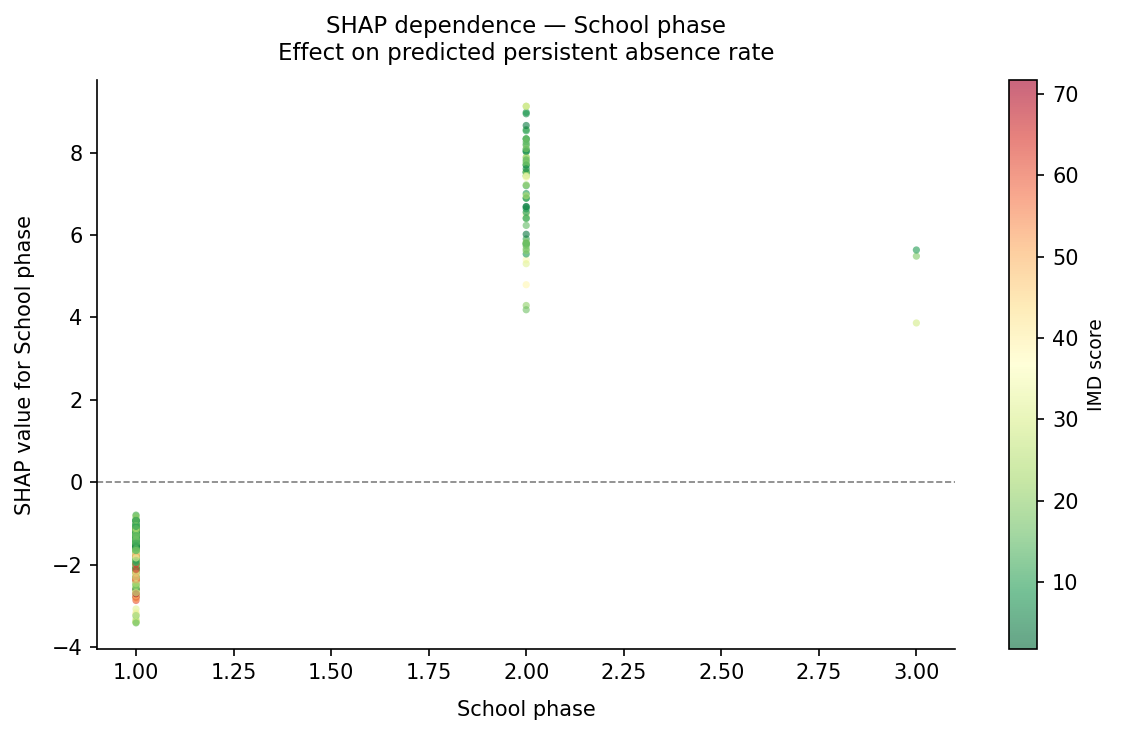
| phase_numeric | 0.209 | 1=Primary, 2=Secondary, 3=All-through |
| log_pupils | 0.044 | Log-transformed school roll |
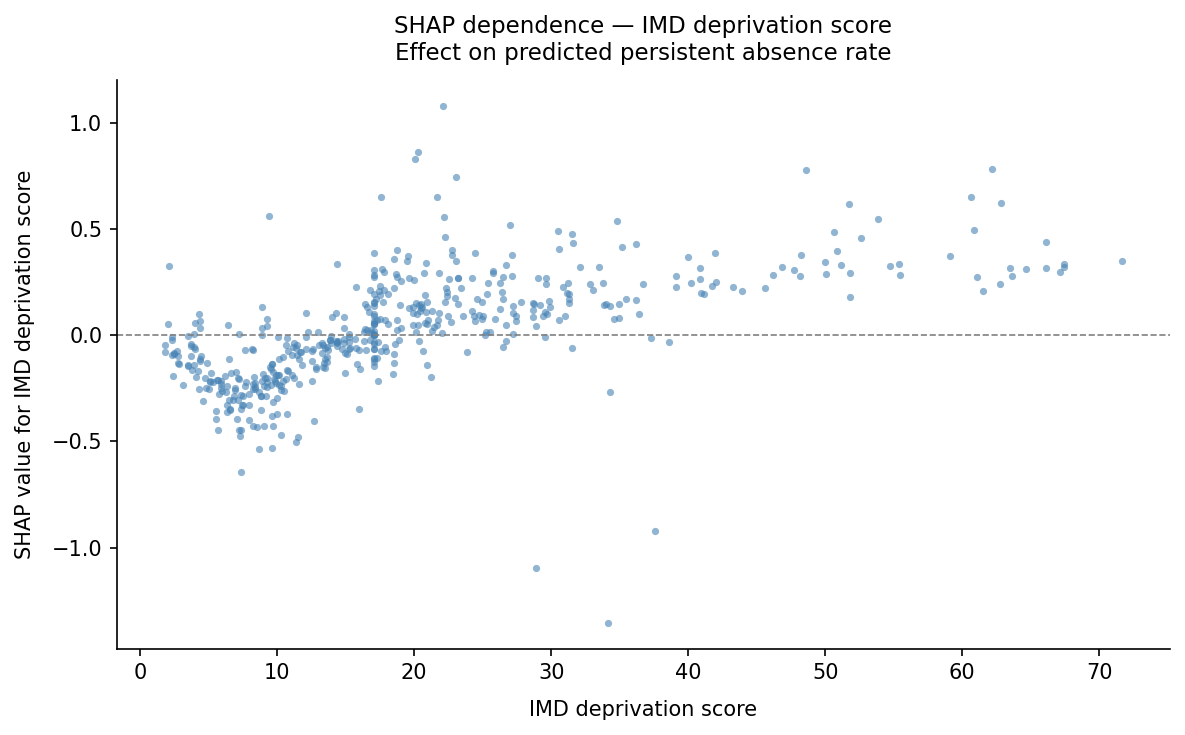
| imd_score | 0.021 | IMD 2019 area deprivation score |
| region_London | 0.013 | London region dummy |
| All other regions + urban flag | 0.018 | — |